There are now more speed bumps than ever on UK roads. This article from Auto Express breaks down the areas of the country with the most speed bumps — we hope you’ll find it interesting.
The number of speed bumps in the UK has increased by five per cent in the last three years, according to new data.
There are now more than 42,000 individual speed bumps in the UK, covering some 2,000 miles of road on 14,000 roads around the country. Furthermore, there are 12,000 other traffic calming measures, such as speed tables, ramps and width restrictions.
The figures came from an investigation by Citroen, which sent Freedom of Information requests to more than 400 councils in the UK.
London Boroughs tend to have the highest number of speed bumps per mile of any local authorities. Newham Council, which is responsible for 125.28 miles of road, said 100 per cent of its roads have speed bumps on them.
Southwark Council was in second, but still quite a long way behind. The local authority is responsible for 210 miles of road, of which 71 per cent – approximately 148.24 miles – have speed bumps. Meanwhile, Hackney has speed bumps on 69 per cent of its 150 miles of road.
|
Local authority (London only) |
Miles of roads with bumps |
Total miles responsible for |
Percentage of roads |
|
1. London Borough of Newham |
125.28 |
125.28 |
100% |
|
2. London Borough of Southwark |
148.24 |
210 |
71% |
|
3. London Borough of Hackney |
104 |
150 |
69% |
|
4. London Borough of Lewisham |
159 |
244 |
65% |
|
5. London Borough of Camden |
86.7 |
159 |
55% |
|
6. London Borough of Hammersmith & |
54.3 |
180.7 |
30% |
|
7. City of Westminster |
28 |
200 |
14% |
|
8. London Borough of Hounslow |
36.6 |
268.4 |
14% |
|
9. Royal Borough of Kensington and Chelsea |
7 |
117 |
6% |
|
10. London Borough of Bexley |
8.76 |
560 |
2% |
Outside of London, Norwich City Council had the most speed bumps per mile – they’re on 17 per cent of its 247.66 miles of road. Portsmouth City Council was third, with potholes on 13 per cent of its 284.6 miles of road, while 12 per cent of Bury Metropolitan Borough Council’s roads have speed bumps.
|
Council |
Miles of roads with bumps |
Total miles responsible for |
Percentage of roads |
|
1. Norwich City Council |
43.06 |
247.66 |
17% |
|
2. Portsmouth City Council |
36.35 |
284.6 |
13% |
|
3. Bury Metropolitan Borough Council |
46 |
400 |
12% |
|
4. South Gloucestershire District Council |
91.5 |
914 |
10% |
|
5. Sheffield City Council |
116.3 |
1217.2 |
10% |
|
6. Rotherham Metropolitan Borough Council |
57 |
700 |
8% |
|
7. Wirral Metropolitan Borough |
60 |
737 |
8% |
|
8. Redcar and Cleveland |
34.93 |
449.8 |
8% |
|
9. Wokingham Council |
31.3 |
456.7 |
7% |
|
10. East Sussex County Council |
107.8 |
1994.6 |
5% |
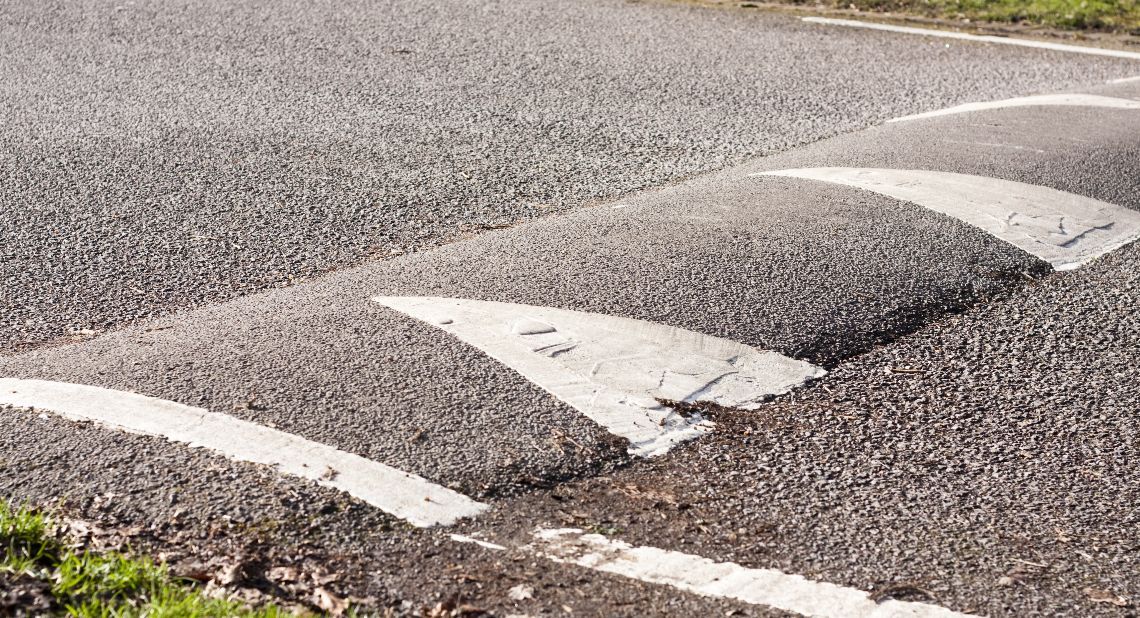
Speed bumps were first introduced in the UK in 1983 under The Highways (Road Humps) Regulations and are designed to slow drivers down in built-up areas.
Under the Highways (Road Humps) Regulations 1999, councils have devolved power from central Government to install humps and associated calming measures on roads with speeds of up to 30mph in the interests of road safety.
Souad Wrixen, marketing director at Citroen UK, commented: “Speed bumps and other traffic calming measures have their place on UK roads helping to improve road safety and reduce fatalities.”
This article was written by Tristan Shale-Hester from Auto Express and was legally licensed through the NewsCred publisher network. Please direct all licensing questions to legal@newscred.com.
Related articles
The latest car safety technology for October 2019
How barrier-free parking can help to make parking easier for people with disabilities
Government invests £348m in local road improvements
![]()